"Our net revenues are up $4,000,000 or 8 percent this quarter. Yippeeee! The oncology business is so easy." If only it were that easy. So often the focus is on net revenue compared to prior periods. The real question to ask: is your net revenue what it should be? There may be significant opportunity costs that are never recognized or, more importantly, never realized. Net revenue can maintain a fairly consistent level because the level of problems (opportunities) stays consistent.
Really understanding net revenue will help maximize net income. Net revenue is multifaceted and is impacted by the volume of services, the mix of services, payer mix, revenue cycle performance (front and back office), payer reimbursement and bad debt. Are you thoroughly monitoring and analyzing each of these areas consistently? If not, I guarantee you have significant opportunity to increase net revenue. Several areas of your revenue cycle could be presenting problems, resulting in nonpayment of claims for services provided. Some payer(s) most likely are not paying correctly and or denying inappropriately.
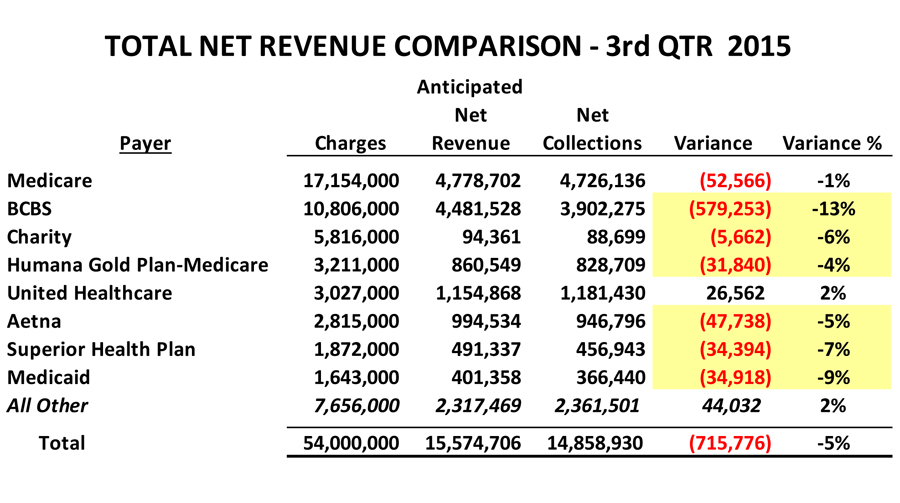
In order to see the big picture net revenue performance, you want to calculate your anticipated net revenue and compare it to your actual net collections. The purpose of this big picture analysis is not to pinpoint specific opportunities but to determine if there are any opportunities. This will tell you how well you’re performing and if there are any particular payer issues that stand out. In the illustration below, it appears there are revenue cycle performance issues and possibly underpayments from BCBS.
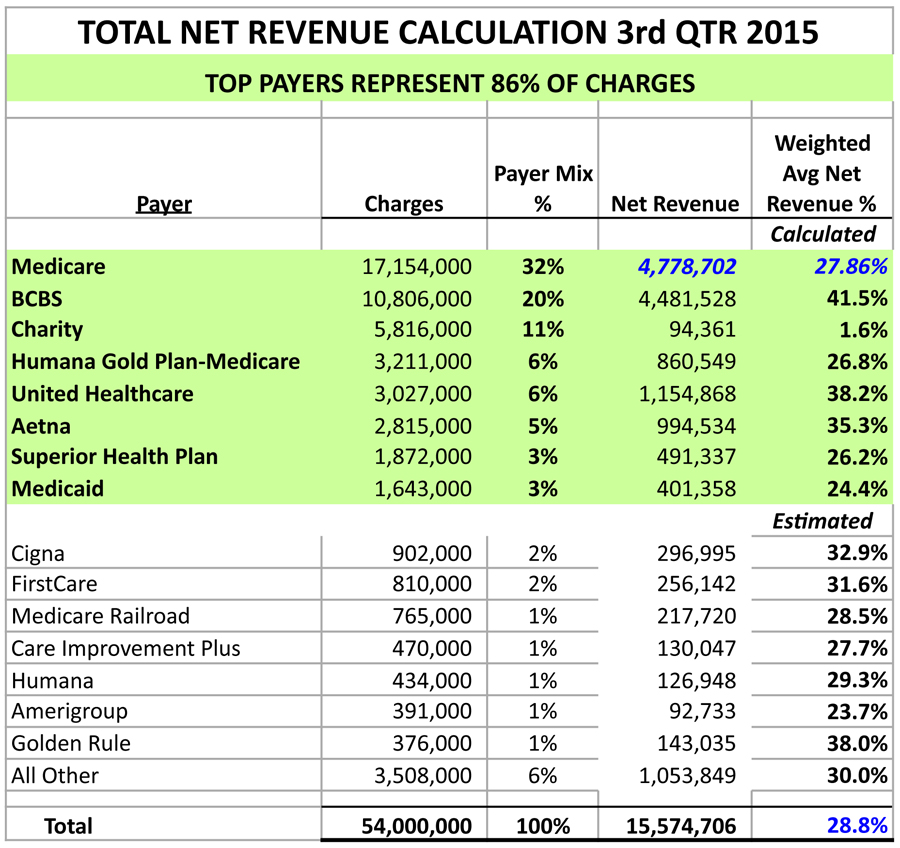
How do you determine what net revenue should be? Calculate a weighted average net revenue percentage for each of your top payers. You can use the 80/20 rule and review the top payers and activity that represent 80+ percent of the total charges. The smaller payers—those that aren’t analyzed individually—should have a net revenue percentage estimated. It may be worthwhile to calculate the weighted average net revenue for one or two different smaller payers each quarter. Continue to use the same net revenue percentage for the small payers in future quarters.
Please see the illustration of the total net revenue calculation below.
Decide on the time period for your analysis. I recommend using a quarter’s worth of data from two or three quarters back. Since it’s May, I would use either the third or fourth quarter of 2015. The actual collections data will be much more accurate as there has been sufficient time for most accounts receivable to be resolved.
Individual payer weighted average net revenue is determined by using that payer’s actual utilization of units and charge amounts. Use the top individual revenue codes representing at least 80+ percent of the gross charges. All other charges can be summed as one number and the net revenue estimated. The payer fee schedule needs to be inputted in order to calculate net revenue for each line item revenue code (units x fee schedule). Net revenue from all the codes is then summed and an estimate for bad debt is subtracted. Use the historical bad debt percentage for that payer, or use your best estimate. The resulting weighted average net revenue represents the anticipated collections from this payer, including the patient’s responsibility. The resulting net revenue should be entered on the top payer’s worksheet.
Please see the illustration of the Medicare net revenue calculation below.
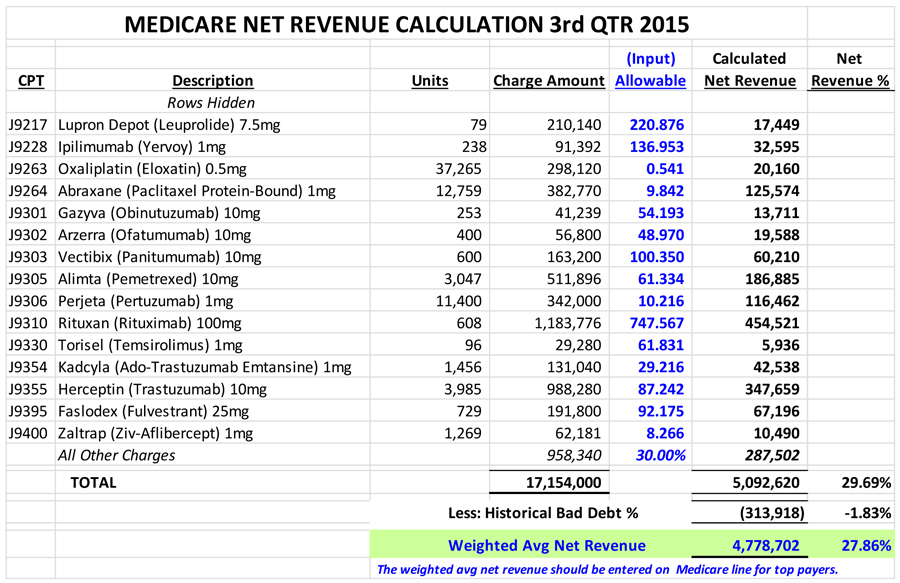
Repeat this calculation for the other top payers.
Next, determine actual net collections (collections less refunds) for each payer. Make sure to use the date of service collections that relate to those quarter’s charges, regardless of when collections were received. Also, estimate realistic collections for any outstanding accounts receivable. The estimated collections should be added to the actual net collections.
The variance in anticipated net revenue and actual net collections should be calculated at the payer level and in total. A variance percentage will help to quantify the magnitude of the variance. Remember, the purpose was not to identify specific opportunities but to determine if there are any opportunities. If your billing system reflects secondary payments under the secondary insurance then another approach is needed or only the practice totals will be usable. When secondary payments are reflected with the secondary insurance, net payments at the patient level should be determined and then rolled up into primary insurance.
Cancer center administrators have lots of responsibilities and may not have time or access to the data in order to perform this type of analysis. Talk to your finance department and see if they have someone who is able to provide support for this type of review. However, if you want someone with the oncology-specific expertise to provide this type of analysis, you should contact us.
The Oncology Group and our affiliate, Revenue Cycle Inc., would like to help you maximize your oncology net income. We offer financial analytics, revenue cycle and business office consulting, Revenue Recovery, strategic planning, managed care and many other services to increase your success. To learn how we can help your oncology program, please give us a call at 512-583-8815 or email us at [email protected].